Information Architecture - Forecasting
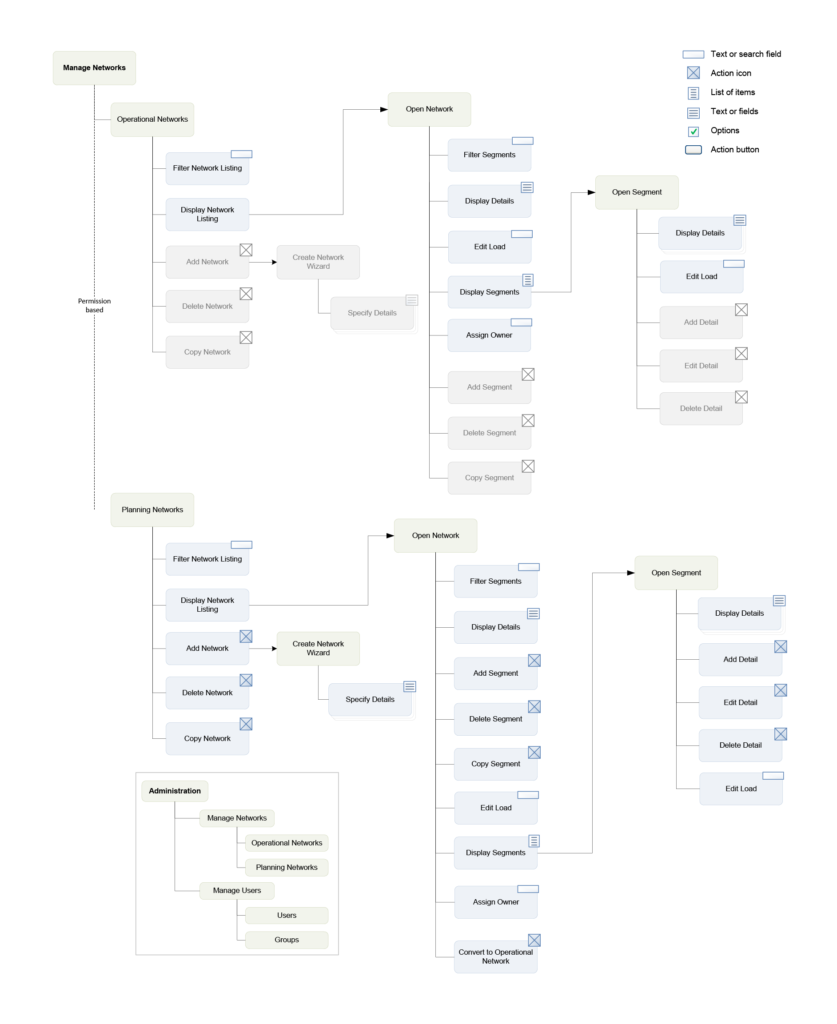
An analytics company was planning a new analytics offering to forecast energy demand within different energy markets. Forecasting demand allows energy companies to purchase power capacity ahead of any peak usage times.
These information architecture diagrams detail how the application functions were to be organized in this new system.
External Dependencies - Taxonomies
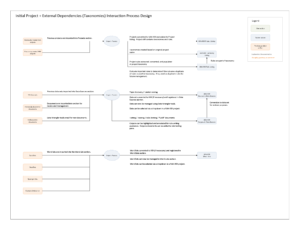
In the project example “Architecture Redesign”, I discuss modifying the architecture of an existing system to improve usability and performance. Although a new architecture is beneficial for new customers, it creates a backward compatibility issue for existing customers. Existing customers need a way to move their existing projects into the new system with little loss or rework.
This example investigates how a proposed system could ingest taxonomies and adapt them within the proposed architecture.
Product Task Analysis
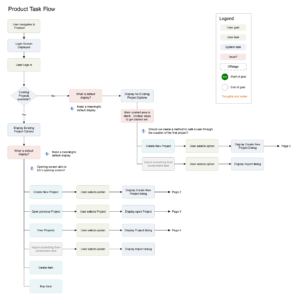
An analytics organization was investigating how all of the products within its portfolio could be organized into a common platform launched from a centralized hub. The UX Designers supporting their respective products were asked to investigate how their products would integrate with the proposed structure.
This example investigates how a text modeling product could integrate with the proposed structure. This diagram illustrates how each of the product’s main task areas and activities could be adapted to fit the proposed structure.
Data Wrangling
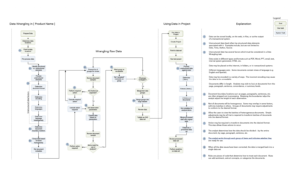
According to experts in statistics and data analysis, well-run projects spend 80% or more of project time preparing tables for analyses. These preparation activities are known as “Data Wrangling”. Table consolidation, cleaning extraneous entries, standardizing variables, creating and manipulating new columns, and others are all types of Data Wrangling activities.
This example investigates how Data Wrangling activities could occur within an analytics product.
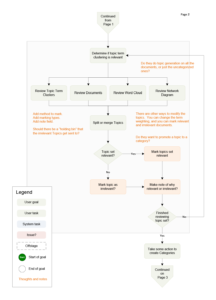
Create Categories Model
The text modeling product I supported allowed users to write code which allowed machines to categorize text passages like people do. One of the areas within that product allowed users to create categorization entries with little coding. Very little time had been spent in analysis and design of this feature, and it wasn’t clear how to use it.
A heuristic evaluations were performed on the existing feature to better understand what human factors and usability issues associated with the existing interface. This diagram proposes a new task which addresses these issues.
